Calgary Real Estate Update – September 2026
The Big Picture
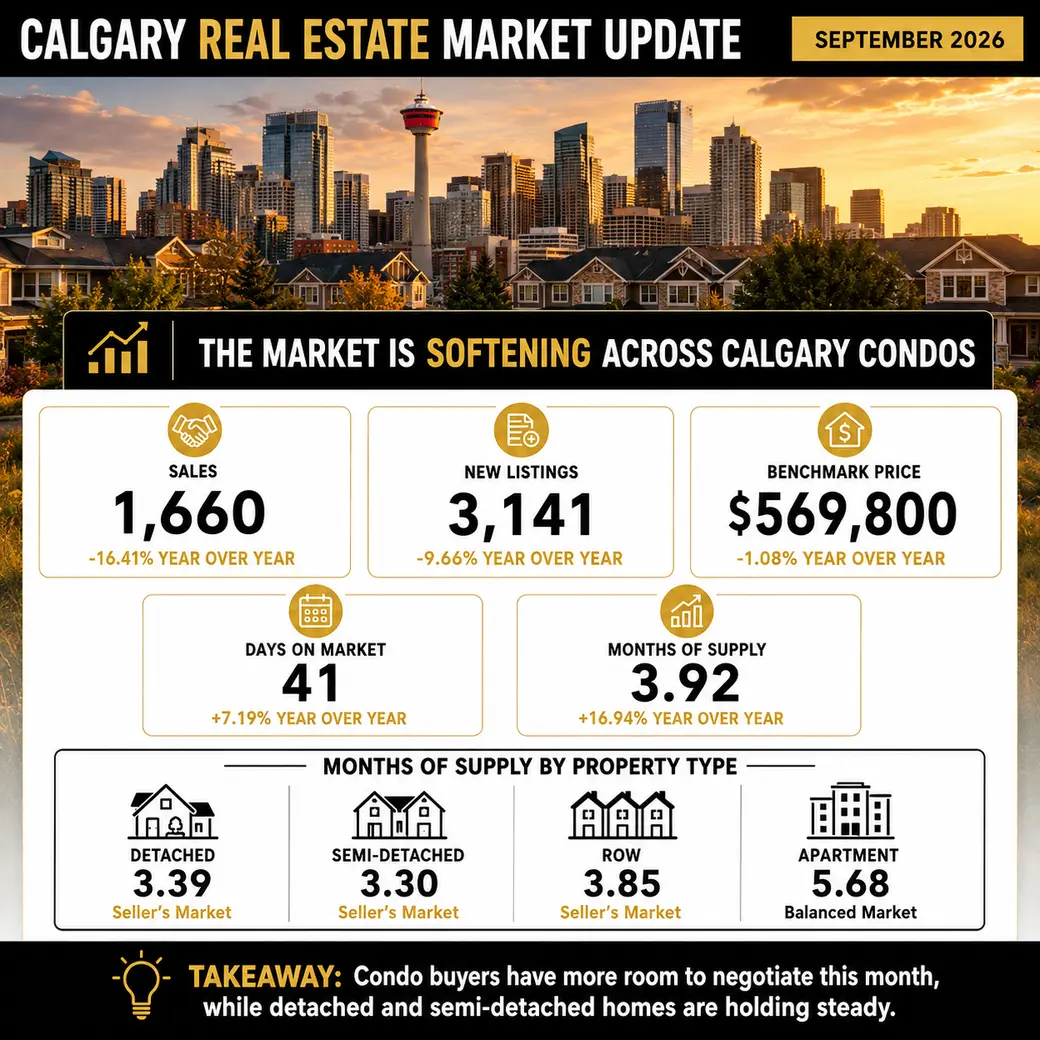
Calgary’s real estate market took a step back in August. Sales came in at 1,660 units, down 16.41% from a year ago, while new listings dropped 9.66% to 3,141. That combination pushed the sales-to-new-listings ratio down to 52.85%, and months of supply climbed to 3.92, up nearly 17% year over year.
The softness isn’t evenly spread. Detached and semi-detached prices barely moved, holding close to where they were a year ago. Apartments and condos told a different story: benchmark prices fell 8.18% year over year to $295,400, the steepest decline of any property type in the city.
CREB’s chief economist, Ann-Marie Lurie, pointed to part of the reason why. Upper-priced homes kept selling as buyers took advantage of improved supply choice, but lower price ranges haven’t seen the same pickup, in her words, because “favourable rental conditions are slowing the transition to ownership.” Rents are falling right along with condo prices, and for a lot of would-be buyers, that’s changing the math on whether now is the time to buy.
The Market, Explained
Across the city, total sales fell to 1,660 units in August, down 16.41% year over year, while new listings dropped to 3,141, down 9.66%. Inventory sits at 6,509 units, down 2.25% year over year. With sales falling faster than inventory, months of supply rose to 3.92, up 16.94% year over year, and the sales-to-new-listings ratio eased to 52.85%.
Homes are also taking a bit longer to sell. Days on market climbed to 41, up 7.19% year over year. The citywide benchmark price landed at $569,800, down just 1.08% year over year, essentially flat. That citywide number hides a lot of variation by property type, though. Detached homes sit at $744,300, down 1.09% year over year. Semi-detached is actually up slightly, 0.98%, to $690,500. Row and townhouse homes are down 5.44% to $415,200. Apartments and condos are down 8.18% to $295,400, the softest segment by far.
Where Interest Rates Stand
The Bank of Canada held its policy interest rate at 2.25% at its September 2, 2026 announcement, continuing a run of holds. The next scheduled announcement is October 28, 2026. In its most recent Monetary Policy Report, the Bank described Canada’s economy as weak but showing signs of improvement, with growth expected to accelerate and inflation to moderate toward its 2% target, though it noted uncertainty remains elevated. For anyone financing a purchase, that’s a steady, if unspectacular, backdrop: rates aren’t rising, but they aren’t falling fast either.
If You’re Buying Right Now
Condos are where the real opportunity is this month. Prices are down 8.18% year over year, months of supply is up to 5.68 for that segment specifically, and sellers have more room to negotiate than they did a year ago. Detached and semi-detached homes haven’t softened the same way, so if you’re set on a house, don’t expect the same kind of room. Get pre-approved before you start touring, and pay attention to district, since the numbers below show real variation across the city.
If You’re Thinking About Selling
If you’re selling a detached or semi-detached home, pricing has held up reasonably well, and homes in City Centre and West are still seeing modest year-over-year gains. If you’re selling a condo, expect more competition and more negotiating from buyers. Pricing realistically from the start matters more in a market like this than it did a year ago, since overpriced listings sit the longest.
If You’re Investing
CREB’s numbers only tell half the story for investors, since they cover ownership, not rent. liv.rent’s August 2026 Alberta Rent Report shows Calgary’s average unfurnished one-bedroom rent down 7.46% year over year to $1,465, and furnished down 16.96% to $1,576. Rents falling alongside condo prices is exactly what CREB’s chief economist pointed to when she said favourable rental conditions are slowing the transition to ownership. That’s worth running through your numbers before buying a condo as a rental: use today’s rents, not last year’s, since the gap between furnished and unfurnished has also widened.
Local Insights: Every Calgary District
Calgary is a district-driven city, and where you’re looking matters as much as what you’re looking for. Here’s how each property type broke down by district in August.
Detached (citywide: $744,300, down 1.09% year over year)
- City Centre: $995,700, up 2.24% year over year, 3.84 months of supply
- North East: $560,500, down 6.44% year over year, 5.36 months of supply
- North: $647,400, down 3.89% year over year, 4.10 months of supply
- North West: $781,500, down 1.30% year over year, 2.62 months of supply
- West: $992,500, up 2.78% year over year, 2.34 months of supply
- South: $715,200, down 1.69% year over year, 2.97 months of supply
- South East: $703,600, down 1.70% year over year, 2.99 months of supply
- East: $489,500, down 3.11% year over year, 3.70 months of supply
Apartment/Condominium (citywide: $295,400, down 8.18% year over year)
- City Centre: $303,500, down 7.53% year over year, 7.58 months of supply
- North East: $251,900, down 12.11% year over year, 9.69 months of supply
- North: $300,900, down 9.31% year over year, 3.89 months of supply
- North West: $283,300, down 8.29% year over year, 4.59 months of supply
- West: $322,500, down 7.78% year over year, 3.39 months of supply
- South: $274,700, down 9.55% year over year, 4.54 months of supply
- South East: $311,600, down 7.97% year over year, 5.74 months of supply
- East: $211,100, down 12.77% year over year, 5.40 months of supply
Semi-Detached (citywide: $690,500, up 0.98% year over year)
- City Centre: $965,700, up 2.09% year over year, 3.56 months of supply
- North East: $423,300, down 6.02% year over year, 4.10 months of supply
- North: $492,300, down 2.19% year over year, 3.15 months of supply
- North West: $680,600, up 2.12% year over year, 3.53 months of supply
- West: $824,000, up 1.43% year over year, 2.42 months of supply
- South: $529,400, down 2.41% year over year, 3.70 months of supply
- South East: $509,400, down 2.00% year over year, 1.83 months of supply
- East: $377,400, down 4.48% year over year, 10.67 months of supply
Row/Townhouse (citywide: $415,200, down 5.44% year over year)
- City Centre: $574,100, down 3.29% year over year, 4.72 months of supply
- North East: $331,100, down 12.22% year over year, 4.33 months of supply
- North: $373,900, down 9.20% year over year, 4.98 months of supply
- North West: $436,800, down 1.20% year over year, 3.62 months of supply
- West: $434,700, down 4.63% year over year, 3.03 months of supply
- South: $376,400, down 4.54% year over year, 3.53 months of supply
- South East: $423,700, down 6.24% year over year, 3.16 months of supply
- East: $259,400, down 12.34% year over year, 3.11 months of supply
A few things stand out this month. City Centre and West are the only districts where detached prices are still up year over year, 2.24% and 2.78% respectively. East and North East are the softest districts across almost every property type, with East apartment prices down 12.77% year over year and North East apartment prices down 12.11%. North East apartments also carry the loosest supply in the city, at 9.69 months. South East stands out for semi-detached activity, an 85.29% sales-to-new-listings ratio, the tightest of any district for that property type.
Regional Snapshot
Airdrie: Year-to-date sales are down 13%, with new listings down 7%. Months of supply is under 4 months, and the benchmark price is $508,800, down 4% year over year and down 1% month over month. Apartment-style homes are seeing steeper declines than the rest of the market there.
Cochrane: Year-to-date sales are up more than 5%, driven largely by semi-detached activity. The sales-to-new-listings ratio is over 60%, and months of supply is around 3 months, still a tight market. Benchmark price is down 2% year over year and down 1% month over month.
Okotoks: The sales-to-new-listings ratio is an elevated 81%, and months of supply is around 2 months, among the tightest conditions in the region. The benchmark price is $608,400, down 2% year over year and down 1% month over month. Supply has been historically low there since 2021.
Chestermere: The sales-to-new-listings ratio is under 30%, and months of supply has climbed to 9 months, the most elevated in the region. Benchmark price is down 1% year over year and running lower than 2025 levels. It’s a growing area that’s currently facing real inventory pressure.
Recent Posts