Calgary market overview: October 2026
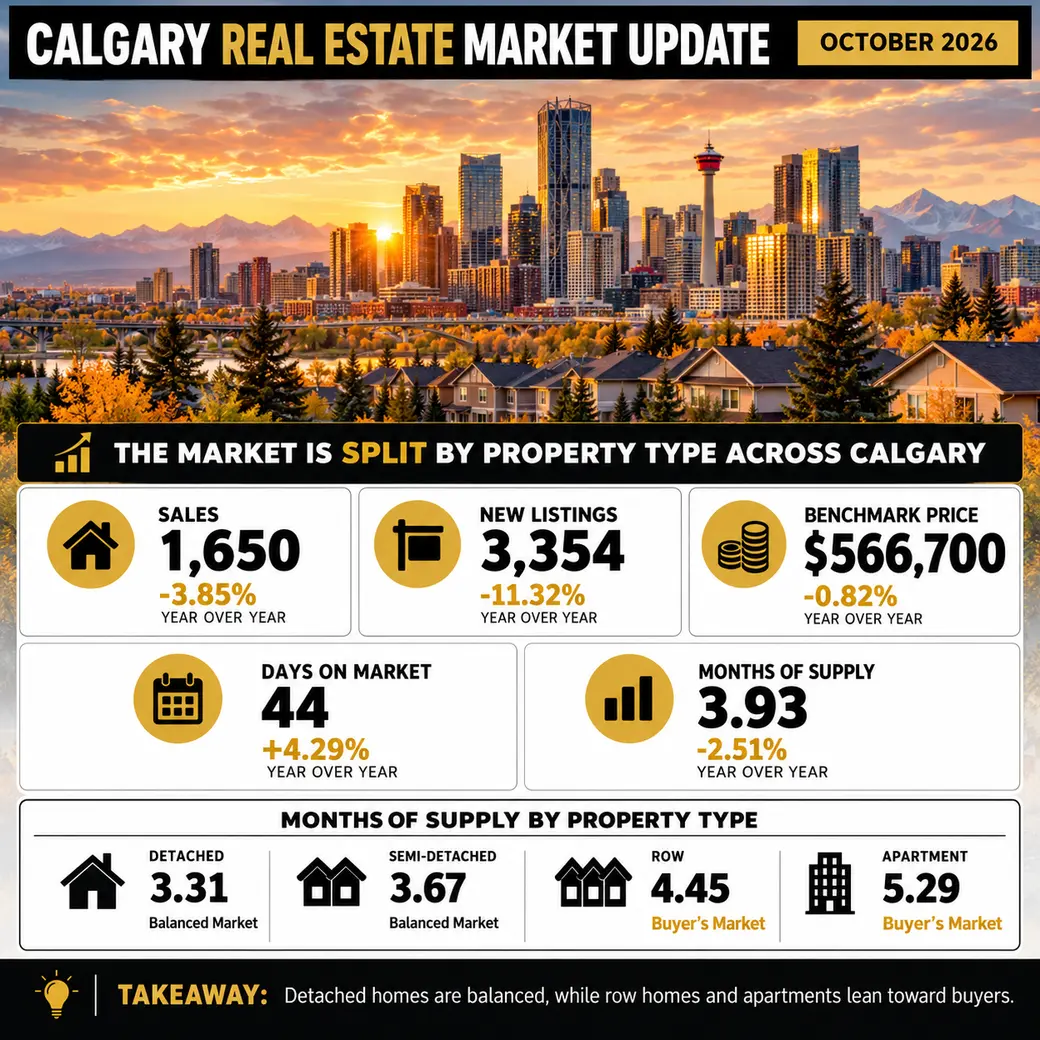
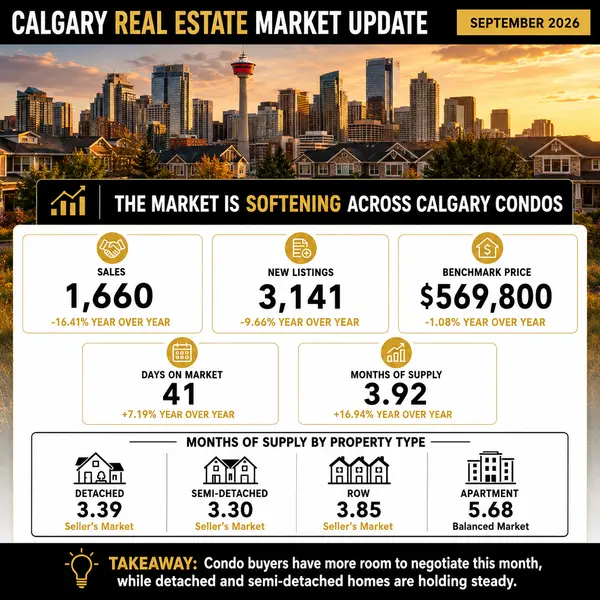
September sales totalled 1,650 units, similar to August and down 3.85% from September 2025. New listings were 3,354, down 11.32% from last year, though they rose from August. That moved the sales-to-new-listings ratio to 49.19%. For comparison, August sales were down 16 percent year over year, which I covered in last month's update.
Inventory ended the month at 6,486, down 6.26% year over year, and months of supply was 3.93, just under four months and unchanged from August. Homes took an average of 44 days to sell, up from 42 days a year ago.
The unadjusted benchmark price was $566,700, down 0.82% from last year. CREB notes that a lot of the monthly softness is seasonal, and seasonally adjusted prices were relatively stable compared with August.
The real story is the split by property type:
- Detached: $739,400, down 0.95% year over year, with 3.31 months of supply
- Semi-detached: $685,200, up 0.09% year over year, with 3.67 months of supply
- Row: $412,400, down 5.54% year over year, with 4.45 months of supply
- Apartment: $291,400, down 8.28% year over year, with 5.29 months of supply
CREB's chief economist, Ann-Marie Lurie, points to where supply was added. Construction over the past three years was mostly in apartments and row-style homes, while detached homes did not see the same boost. A stronger job market and slower but positive net migration have kept demand strong enough to absorb some of that supply, but not all of it in the higher-density segments.
Where the market varies across Calgary
Detached (citywide: $739,400, down 0.95% year over year)
- City Centre: $981,300, up 0.72% year over year, 3.50 months of supply
- North East: $556,600, down 6.01% year over year, 5.61 months of supply
- North: $640,200, down 3.80% year over year, 3.19 months of supply
- North West: $781,400, down 0.66% year over year, 2.86 months of supply
- West: $993,700, up 2.69% year over year, 2.73 months of supply
- South: $709,400, down 0.82% year over year, 2.75 months of supply
- South East: $698,900, down 1.55% year over year, 3.34 months of supply
- East: $476,200, down 4.99% year over year, 3.33 months of supply
Apartment (citywide: $291,400, down 8.28% year over year)
- City Centre: $297,900, down 8.08% year over year, 5.77 months of supply
- North East: $249,500, down 13.07% year over year, 15.38 months of supply
- North: $298,400, down 9.02% year over year, 4.68 months of supply
- North West: $274,900, down 7.97% year over year, 5.00 months of supply
- West: $321,700, down 6.62% year over year, 3.89 months of supply
- South: $271,900, down 9.22% year over year, 4.61 months of supply
- South East: $309,100, down 7.95% year over year, 4.53 months of supply
- East: $209,800, down 13.13% year over year, 4.30 months of supply
The North East is where most of the oversupply sits, and the West is the strongest district for detached homes. Row homes are down year over year in every district, from 2.01% in the North West to 12.53% in the East.
Around the region
- Airdrie: benchmark price of $505,800, nearly four per cent lower than last year, with four months of supply
- Cochrane: five months of supply, with prices similar to last year
- Okotoks: benchmark price of $606,800, stable relative to last September, with just over two months of supply
- Chestermere: benchmark price of $690,200, similar to last year, with months of supply back below six months
Interest rate context
The rate has been 2.25% since October 2025, when the second of two 0.25% cuts (in September and October 2025) brought it down from 2.75%, and the Bank has held it there at every announcement since December 2025.
The Bank noted that CPI inflation was around 3%, mostly driven by gasoline prices, while core inflation stayed near 2%. It also pointed to new US tariffs and trade tensions as a risk to the recovery. The next announcement is October 28, 2026.
With the rate holding steady, financing costs aren't the thing changing the market right now. Supply, property type and district are doing most of the work.
What it means for buyers
Your negotiating room depends on what you're shopping for. Row homes (4.45 months of supply) and apartments (5.29 months) lean toward buyers, with average days on market of 50 and 55. You have more choice and more time than you've had in a while, and new construction is competing for the same buyers.
Detached homes are more balanced at 3.31 months and 38 days on market, and the North West, West and South all have under three months of supply. Good homes in those areas still move.
A lower price on a condo isn't automatically a better deal. Look at the building, the fees, and how many similar units are on the market next to you. If you're a first-time buyer comparing a condo with a home that has a legal suite, this is a good month to run both sets of numbers side by side. If that idea is new to you, I've written about how a legal suite's rent counts toward a Calgary mortgage and how to house-hack your first home.
What it means for sellers
If you own a detached home, buyers are still active. Detached sales were up 4.43% from last year, and the sale to list price ratio citywide was 97.39%, so pricing it right from day one matters more than waiting for a better month.
If you own a condo or row home, expect buyers to compare you against more listings and more new construction. CREB notes the price spread between new and resale row homes is narrow, so presentation and pricing both count. If you don't have to sell this fall, it's worth looking at all your options, including holding or renting.
What it means for investors
Both the ownership side and the rental side are softer, and it helps to look at them together. Apartment benchmark prices are down 8.28% and row prices are down 5.54%, which can open up entry points for patient buyers.
On the rental side, liv.rent's September 2026 Calgary report put the average unfurnished one-bedroom at $1,442, down 1.58% from August. Furnished one-bedrooms averaged $1,539, down 2.34% from August, which leaves a $97 gap between furnished and unfurnished. By quadrant, the Southwest was the most expensive for unfurnished one-bedrooms at $1,521 and the Northeast the most affordable at $1,268. The Southeast was the only quadrant where unfurnished one-bedroom rents rose to $1,490. If you're running numbers on a two-bedroom suite, unfurnished two-bedrooms ranged from $1,574 in the Northeast to $2,048 in City Centre, with the Northwest at $1,731. These rental figures are from liv.rent, not CREB.
When prices and rents are both softening, the cash flow math matters more than the purchase price. Run the numbers on today's rent, not last year's. If you already own a home with a legal suite, I went through how to stress-test it in this post on whether your legal suite still covers the mortgage.
If any of this made you think about your own plans, I'm always happy to talk through what the numbers look like for your specific property type and part of the city.
Disclaimer: This post is general market information, not financial or investment advice. Figures are current as of the publish date. Sources: CREB (September 2026 data), Bank of Canada, and liv.rent (September 2026 report).
Recent Posts